Analyzing Business Processes: A Visual Approach with Python Graphviz
Introduction
In business operations, understanding the intricate flow of activities is essential for optimizing efficiency and identifying potential bottlenecks. One effective way to unravel these complexities is through the use of visual representations. In this blog post, we discuss business process graph using Graphviz.
Unveiling the Graph
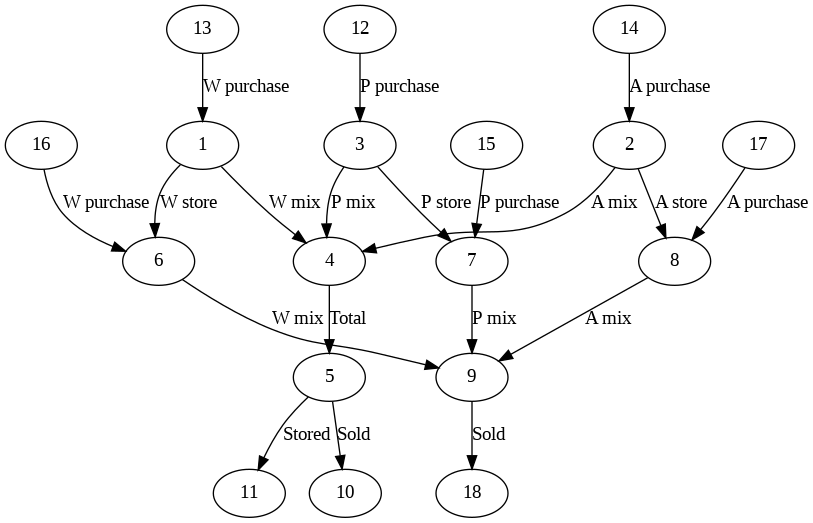
Let’s start by examining the graph representation of a business process. The diagram showcases the interconnections between various steps involved in the journey of products, from purchase to final sale.

import graphviz
from IPython.display import Image

dot_code = """
digraph G {
    13 -> 1 [label="W purchase"];
    1 -> 6 [label="W store"];
    1 -> 4 [label="W mix"];
    4 -> 5 [label="Total"];
    5 -> 10 [label="Sold"];
    5 -> 11 [label="Stored"];
    3 -> 4 [label="P mix"];
    3 -> 7 [label="P store"];
    12 -> 3 [label="P purchase"];
    14 -> 2 [label="A purchase"];
    2 -> 4 [label="A mix"];
    2 -> 8 [label="A store"];
    15 -> 7 [label="P purchase"];
    7 -> 9 [label="P mix"];
    16 -> 6 [label="W purchase"];
    6 -> 9 [label="W mix"];
    17 -> 8 [label="A purchase"];
    8 -> 9 [label="A mix"];
    9 -> 18 [label="Sold"];
}
"""

eng = 'dot'
# Create a Graph object
graph = graphviz.Source(dot_code, format='png', engine=eng)

# Save the graph to a file
graph.render(filename='output', cleanup=True, format='png', engine=eng)

# Display the graph using the default viewer (requires Graphviz installed)
graph.view()

# Display the generated image directly
Image(filename='output.png')
The nodes in the graph represent different stages of the process, while the labeled edges signify the transitions and operations between them. This visualization aids in comprehending the relationships and dependencies within the business workflow.
Breaking Down the Structure
Upon careful inspection, several interesting patterns emerge from the graph. For instance, the ‘W mix’ and ‘P mix’ nodes act as crucial junctions where different product types converge before proceeding to the next stages. Additionally, the ‘Sold’ and ‘Stored’ nodes depict the ultimate destinations for the products, indicating the outcomes of the entire process.
Key Observations
One noteworthy aspect is the intertwined nature of product paths. Products from different sources, denoted by ‘W’, ‘P’, and ‘A’, often merge at certain points before reaching the final stages. This convergence highlights the complexity and integration of various supply channels within the business model.
Mass Balance Equations
Let’s attempt to derive simplified mass balance equations based on the provided graph. The graph represents a system involving the purchase, storage, mixing, and selling of items denoted by W, P, and A.
Let’s use the following symbols:
- \(C_{\text{W_purchase}}\), \(C_{\text{P_purchase}}\), and \(C_{\text{A_purchase}}\) as the mass flow rates for the purchase of W, P, and A, respectively.
- \(C_{\text{W_store}}\), \(C_{\text{P_store}}\), and \(C_{\text{A_store}}\) as the mass flow rates for storing W, P, and A, respectively.
- \(C_{\text{W_mix}}\), \(C_{\text{P_mix}}\), and \(C_{\text{A_mix}}\) as the mass flow rates for mixing W, P, and A, respectively.
Now, let’s write the mass balance equations:
\[ C_{\text{W_purchase}} = C_{\text{W_store}} + C_{\text{W_mix}} \]
\[ C_{\text{P_purchase}} = C_{\text{P_store}}+ C_{\text{P_mix}} \]
\[ C_{\text{A_purchase}} = C_{\text{A_store}} + C_{\text{A_mix}} \]
These equations represent the balance between the total mass of items purchased and the total mass of items stored and mixed within the system. It does not account for sales or stored items being sold.
Engineered Insights
The use of Graphviz allows for a systematic analysis of the business process, enabling stakeholders to identify critical junctures, potential areas for improvement, and overall process efficiency. The straightforward nature of the visual representation ensures a clear and unambiguous interpretation.
Conclusion
In conclusion, dissecting a business process graph with tools like Graphviz offers a valuable perspective on the inner workings of operations. Adopting an analytical approach paves the way for informed decision-making and optimization of business processes.

