Building a Semantic Model in Power BI with Microsoft Fabric
Introduction
This blog post guides you through building a semantic model within Power BI while leveraging Microsoft Fabric as the underlying data platform. We’ll walk through the process visually, with screenshots embedded throughout, to help you create a workspace, configure settings, and ultimately build the data model for your reports.
Creating a Power BI Workspace in Microsoft Fabric
-
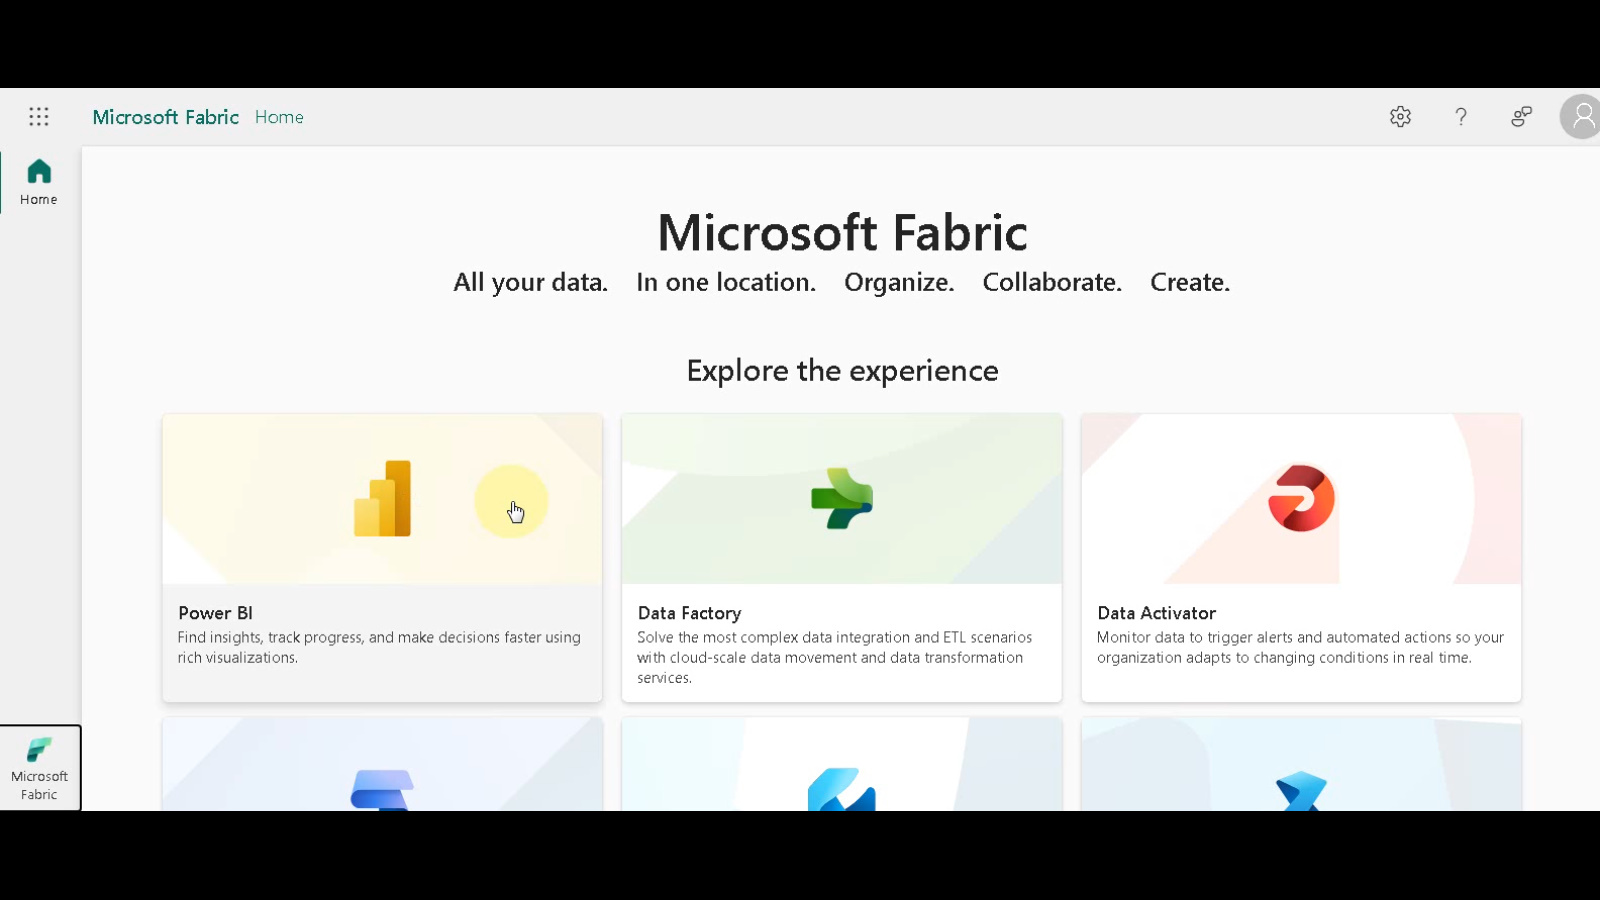
Navigate to Workspaces: Within Microsoft Fabric, locate the “Workspaces” section.
-
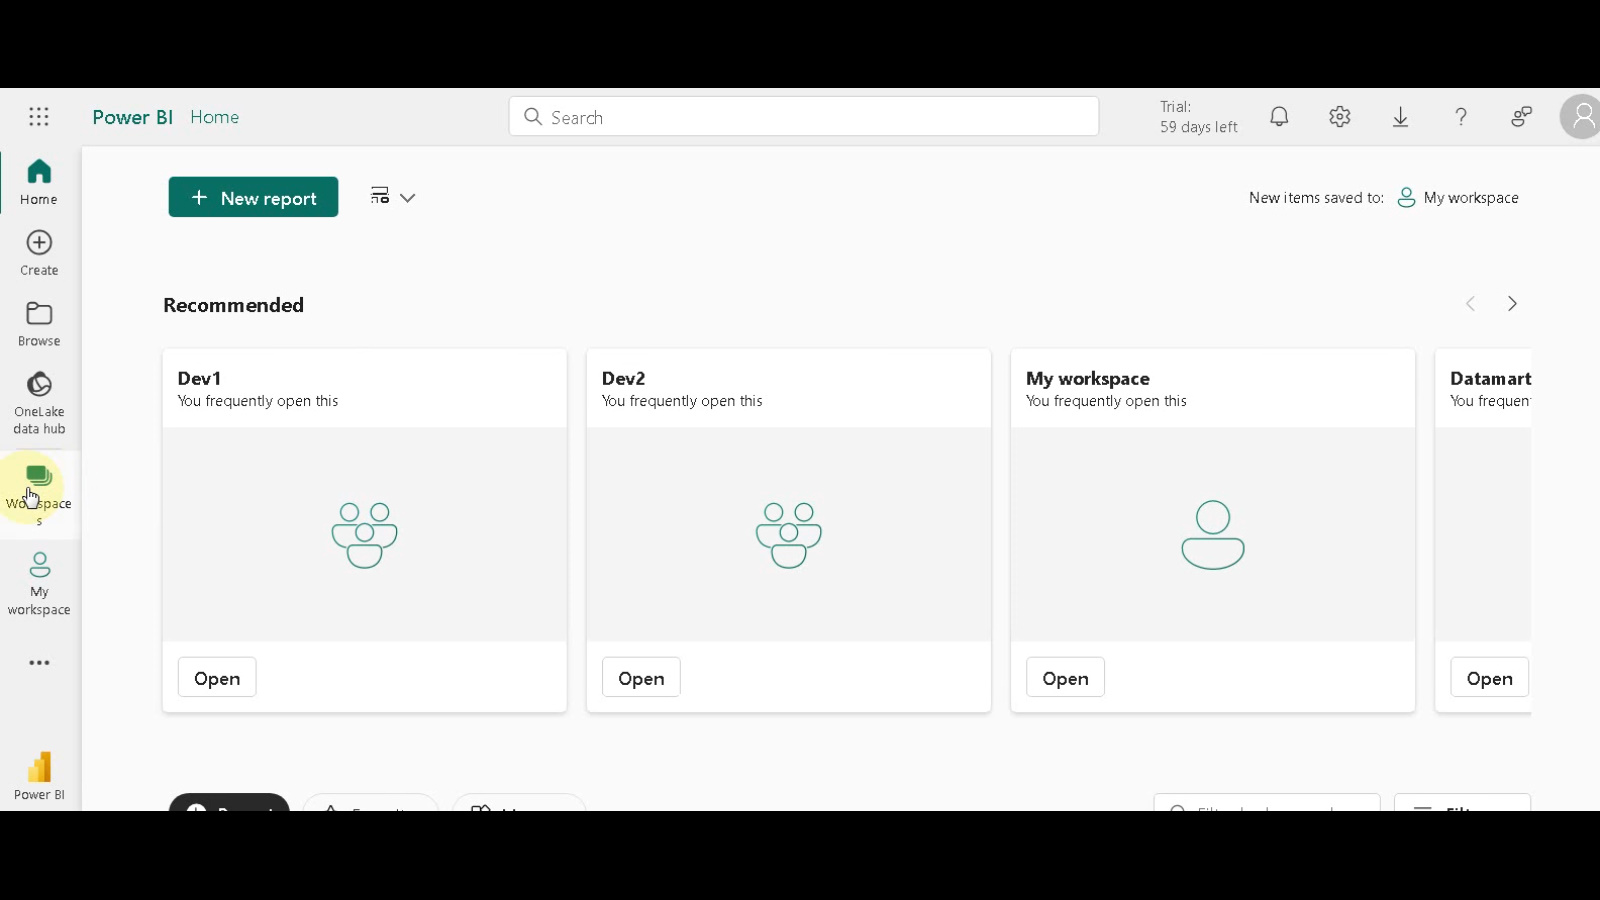
Add a New Workspace: Click the “Add new workspace” button. This button typically has a plus sign (+) symbol.
-
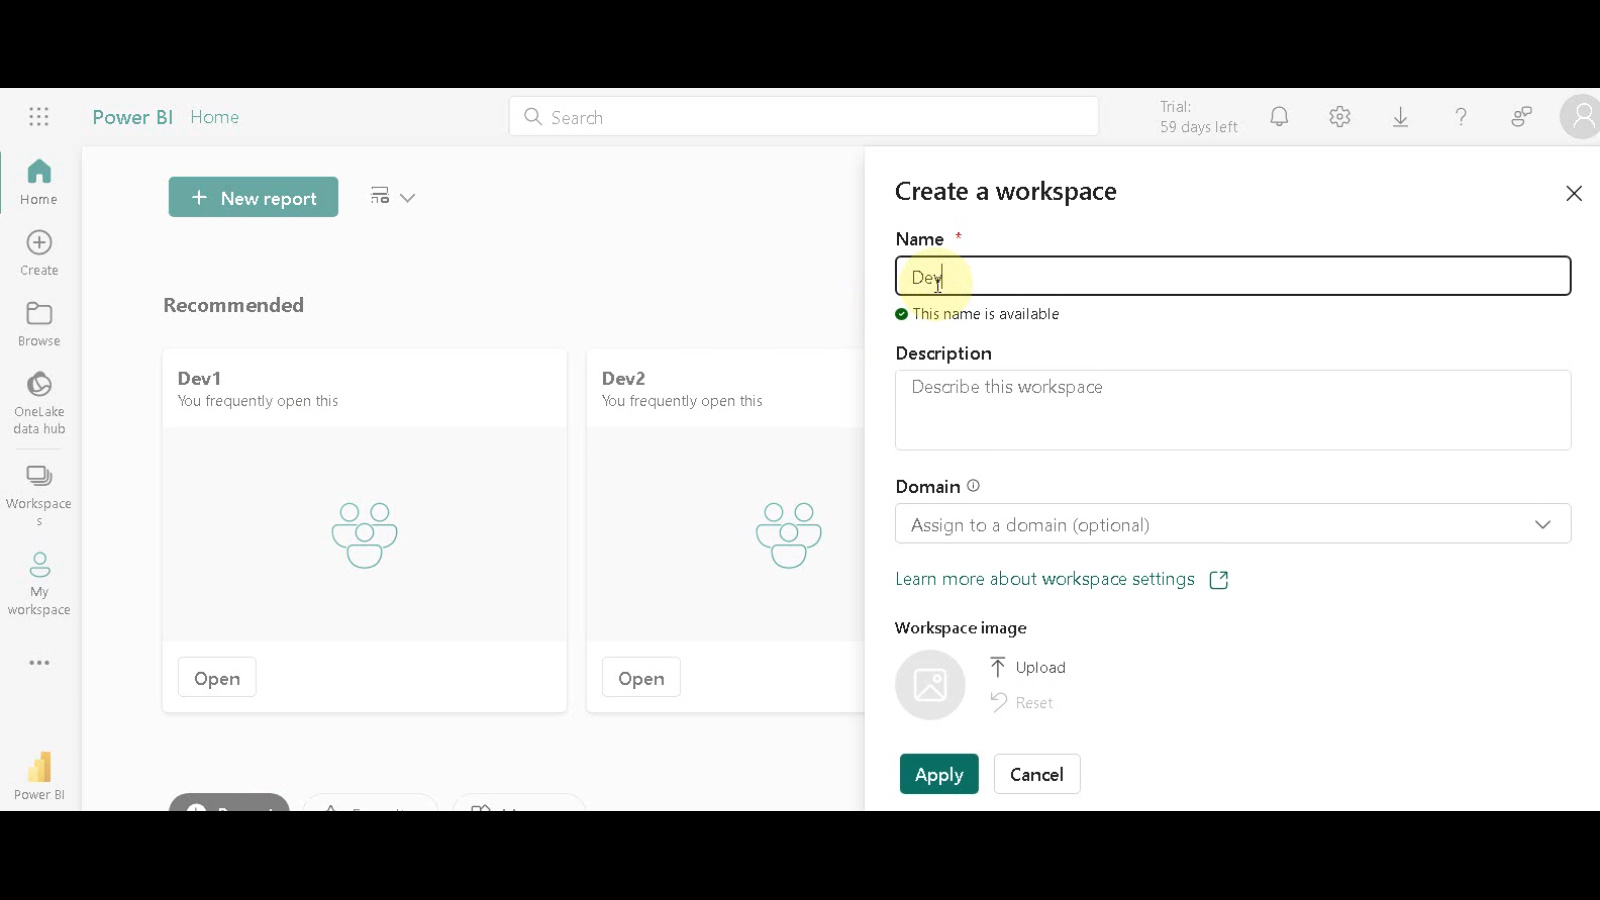
Name Your Workspace: Enter a descriptive name for your workspace that reflects its purpose. In our example, we’ll name it “dev” for development purposes.
-
Apply Workspace Creation: Click “Apply” to finalize the creation of your new workspace.
Enabling Data Model Editing
-
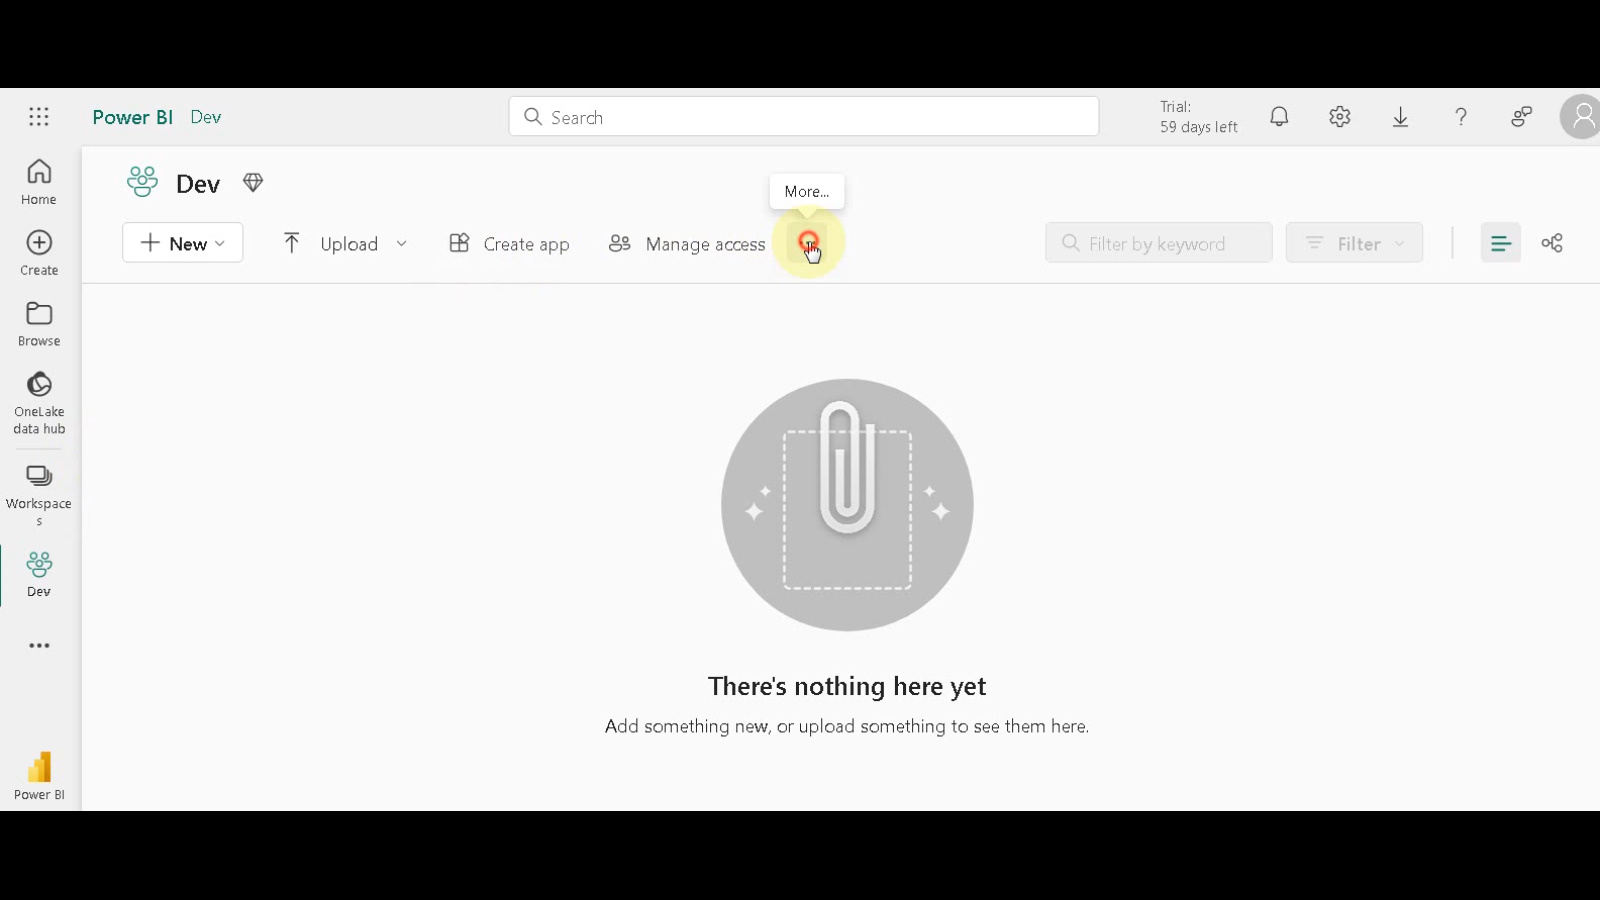
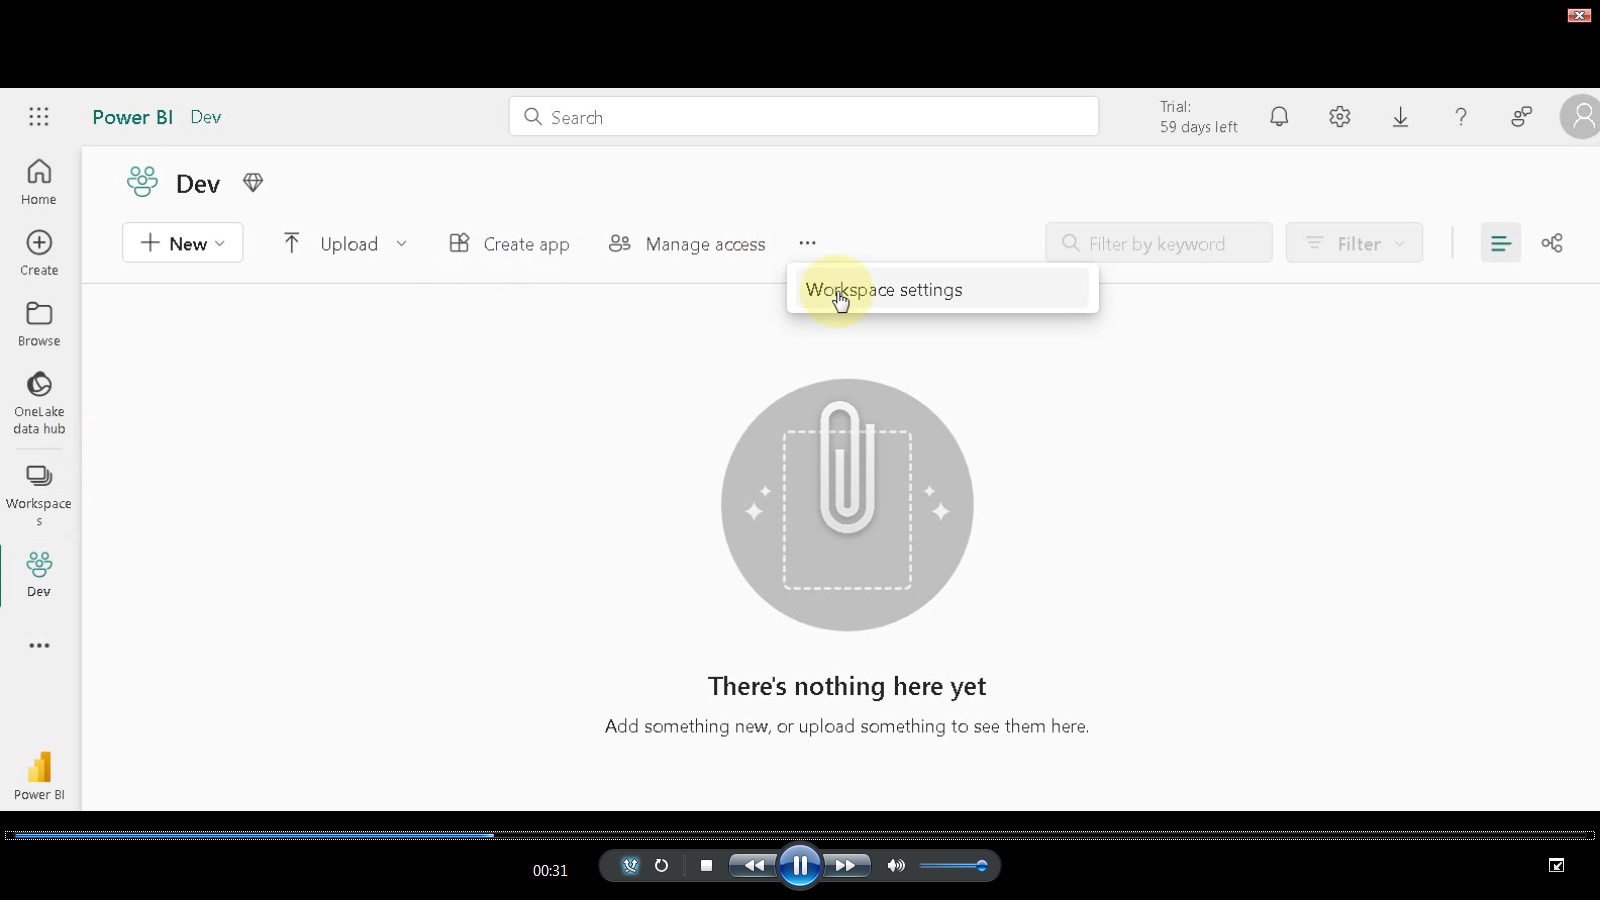
Access Workspace Settings: Click the three dots in the top right corner of your newly created workspace. This will reveal a dropdown menu.
-
Navigate to Power BI Section: Locate the “Workspace settings” option within the dropdown menu and click on it.
-
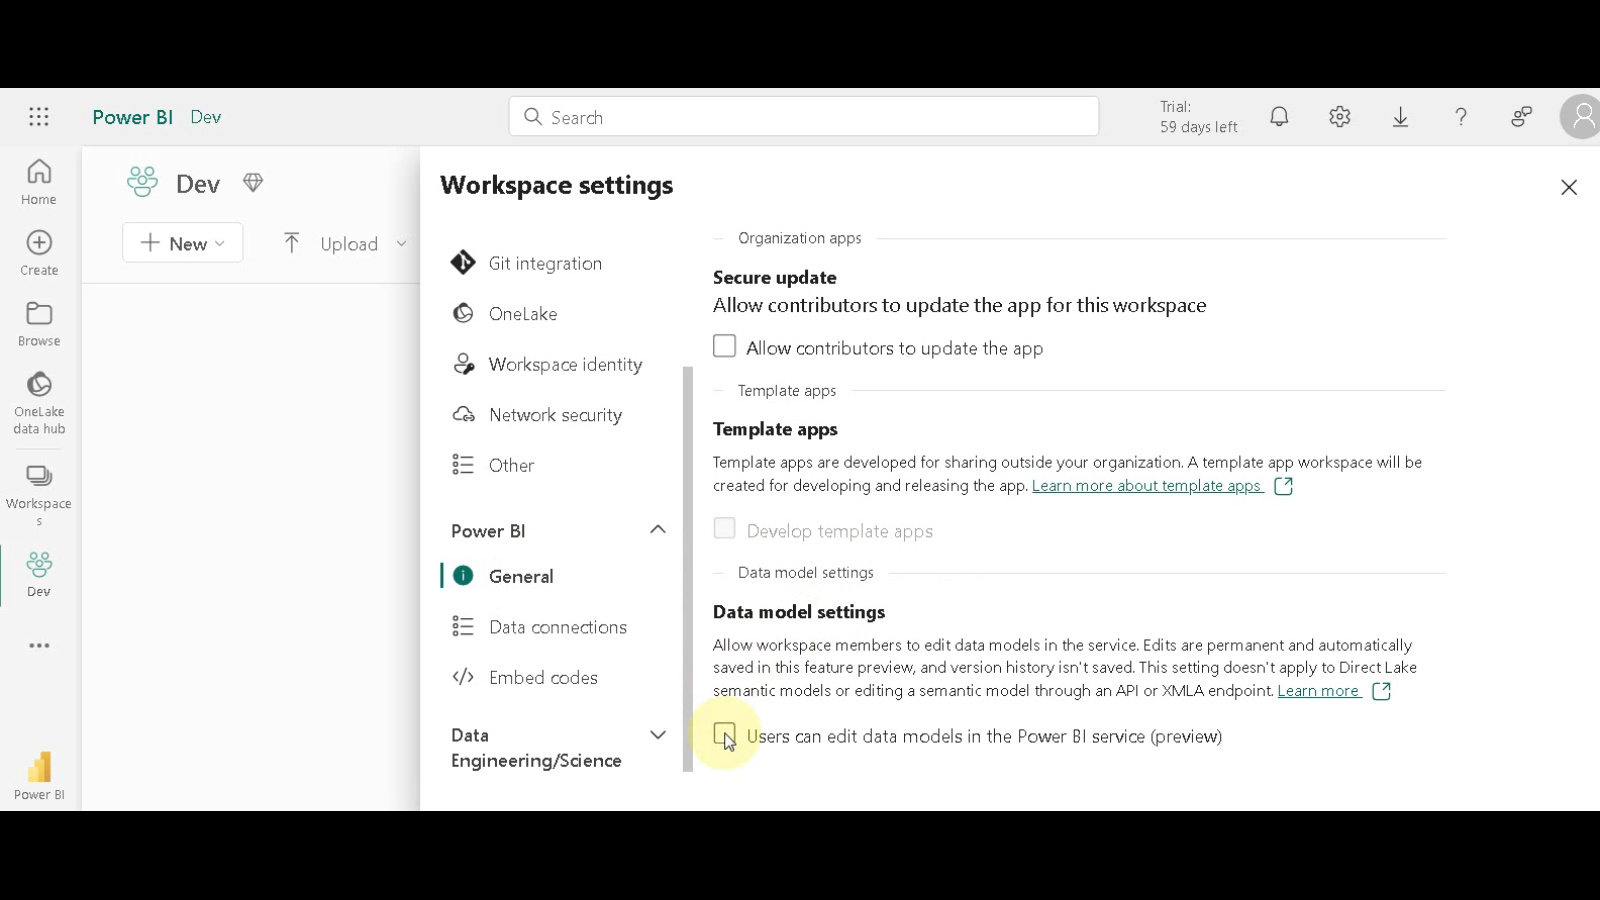
Enable Data Model Editing: Under the “General” section within the workspace settings, find the “Data model settings” section. Click the checkbox for “Users can edit data models in the Power BI service (Preview)”.
Building the Report and Data Model
-
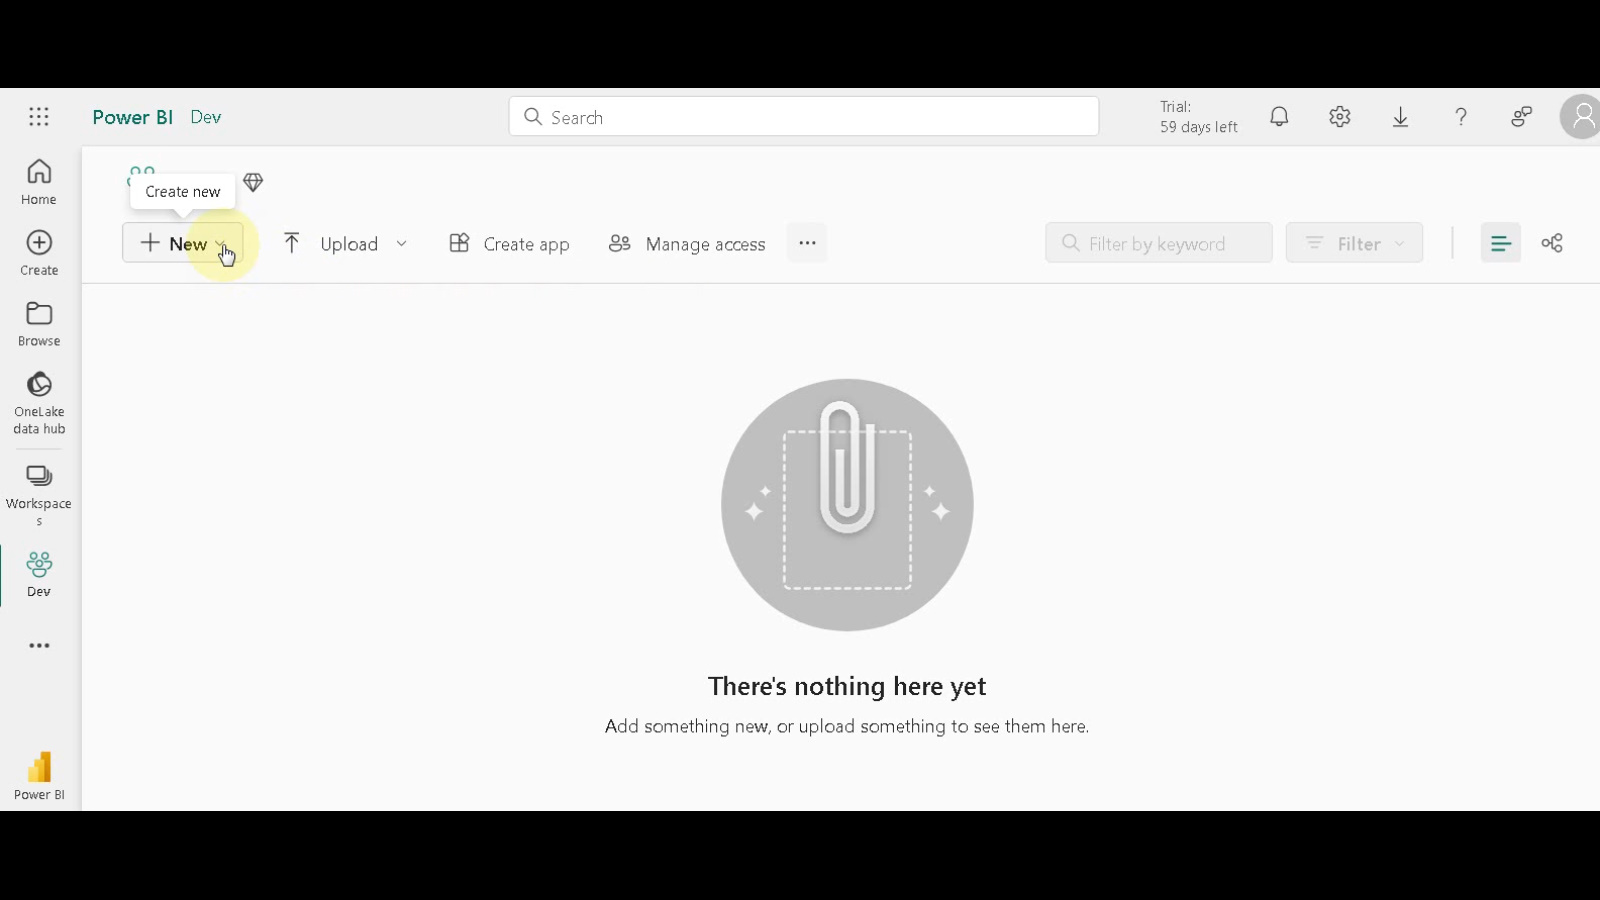
Create a New Report: Launch Power BI Desktop and click on “New” to initiate the report creation process. From the dropdown menu, choose “Report”.
-
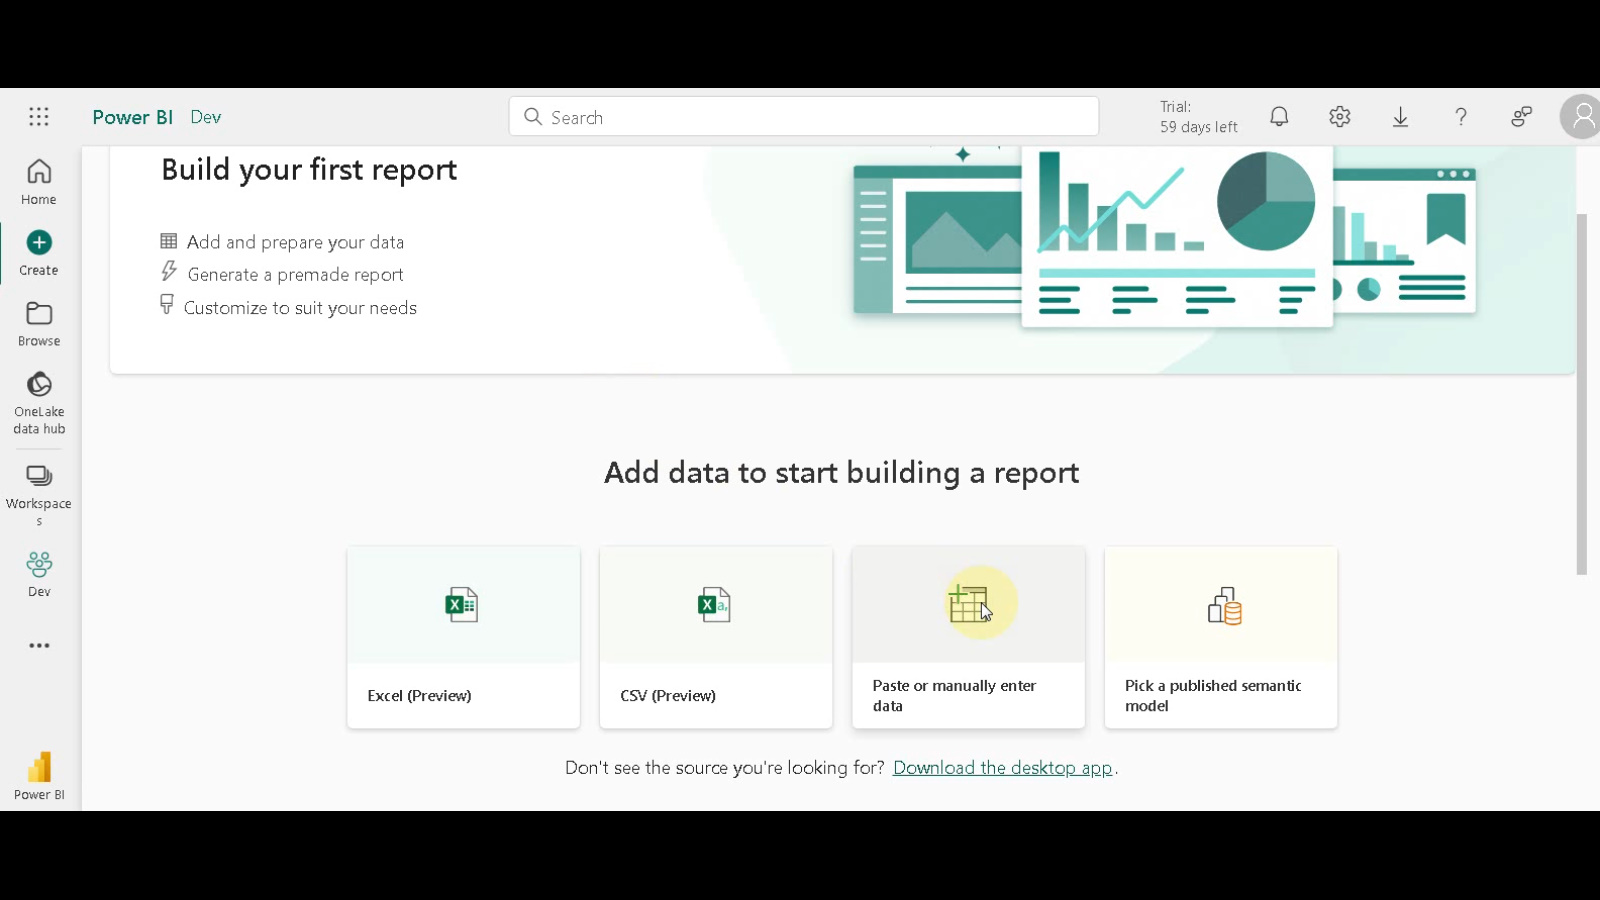
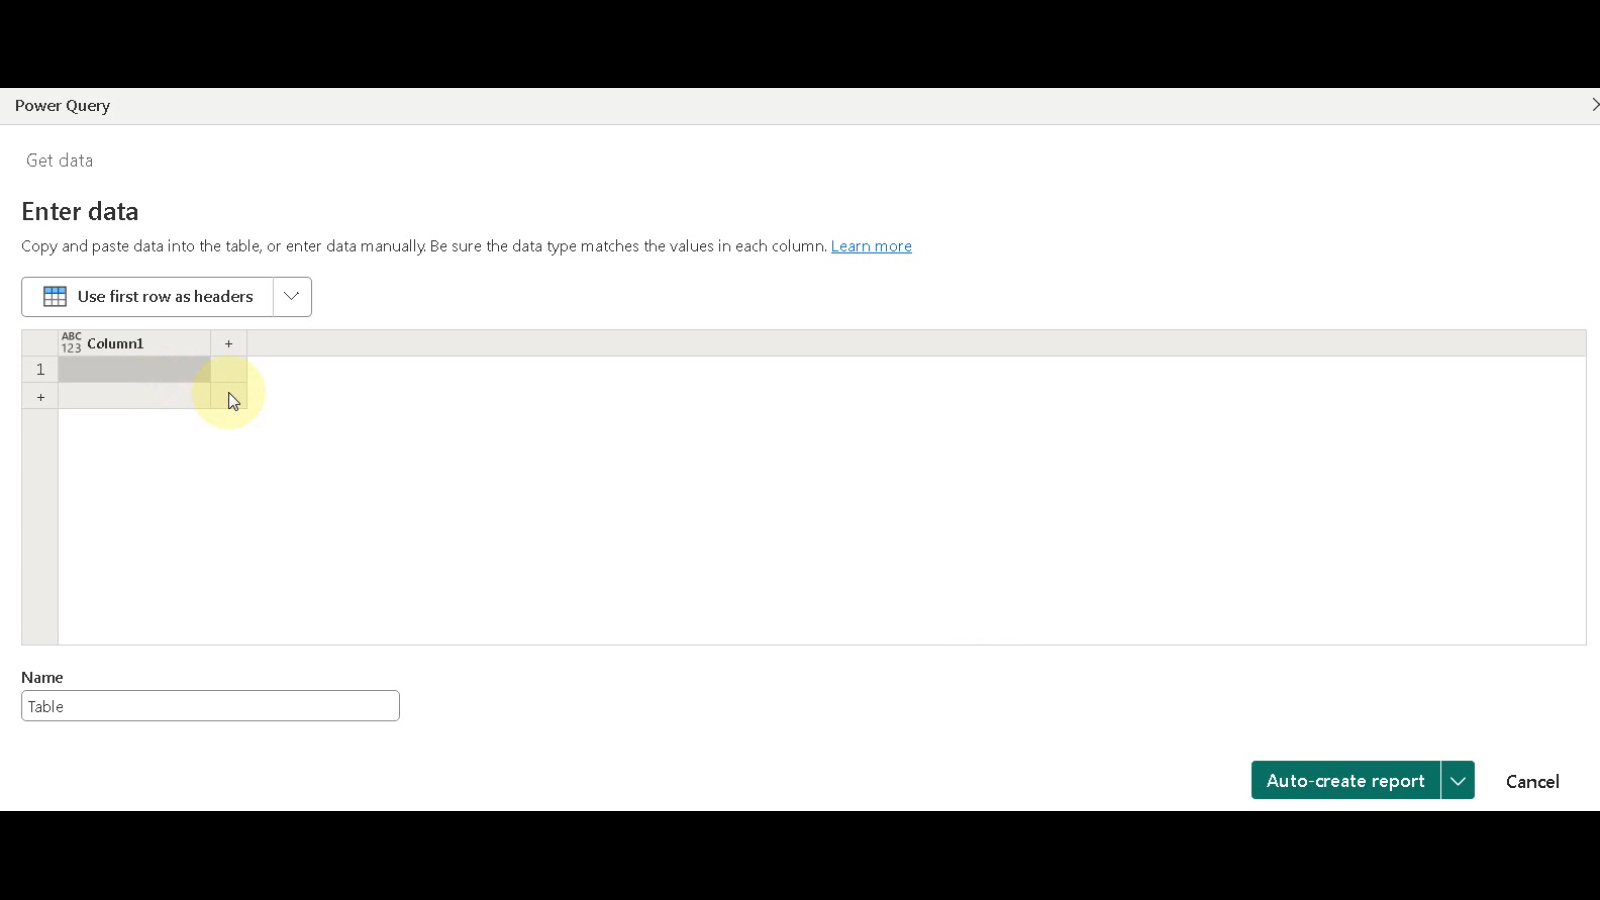
Paste or Import Data: You have two options for bringing your data into Power BI Desktop. Click the “Paste data” button if you have your data copied on your clipboard, or choose “Manually enter data” if you want to input it directly.
-
Paste Your Data: If you chose to paste your data, paste it from your source (like Excel) into the provided grid within Power BI Desktop.
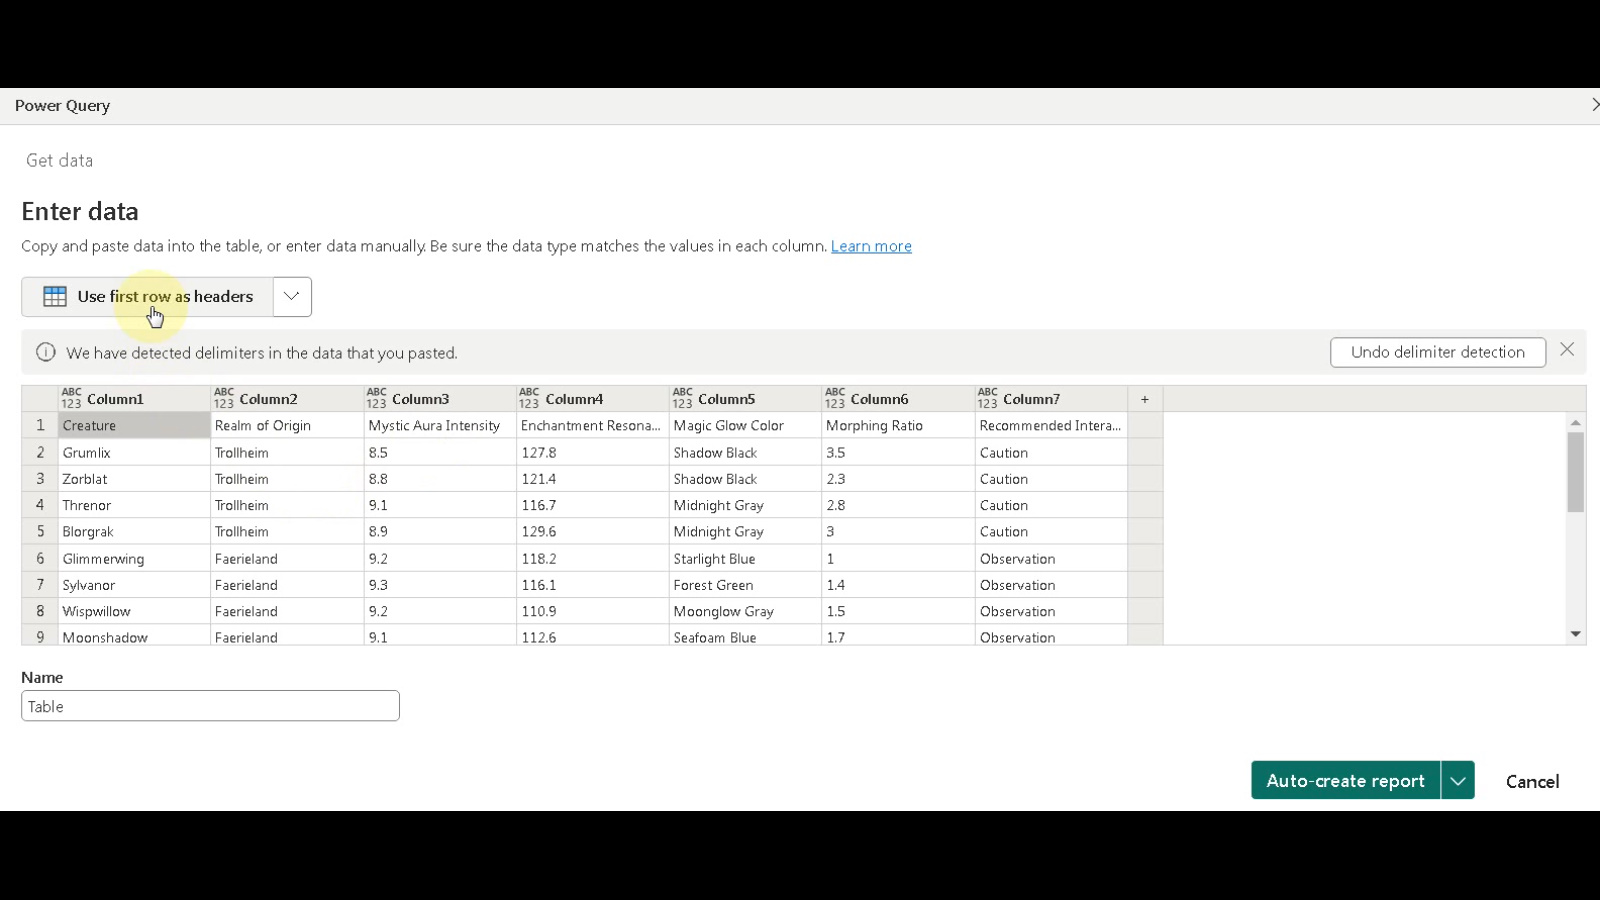
- Configure Data Table:
- Click the button to “Use first row as headers” to ensure your column headers are recognized correctly.
- Assign a name to your table, something meaningful that reflects the data it contains. In this example, we’ll name it “FactTable”.
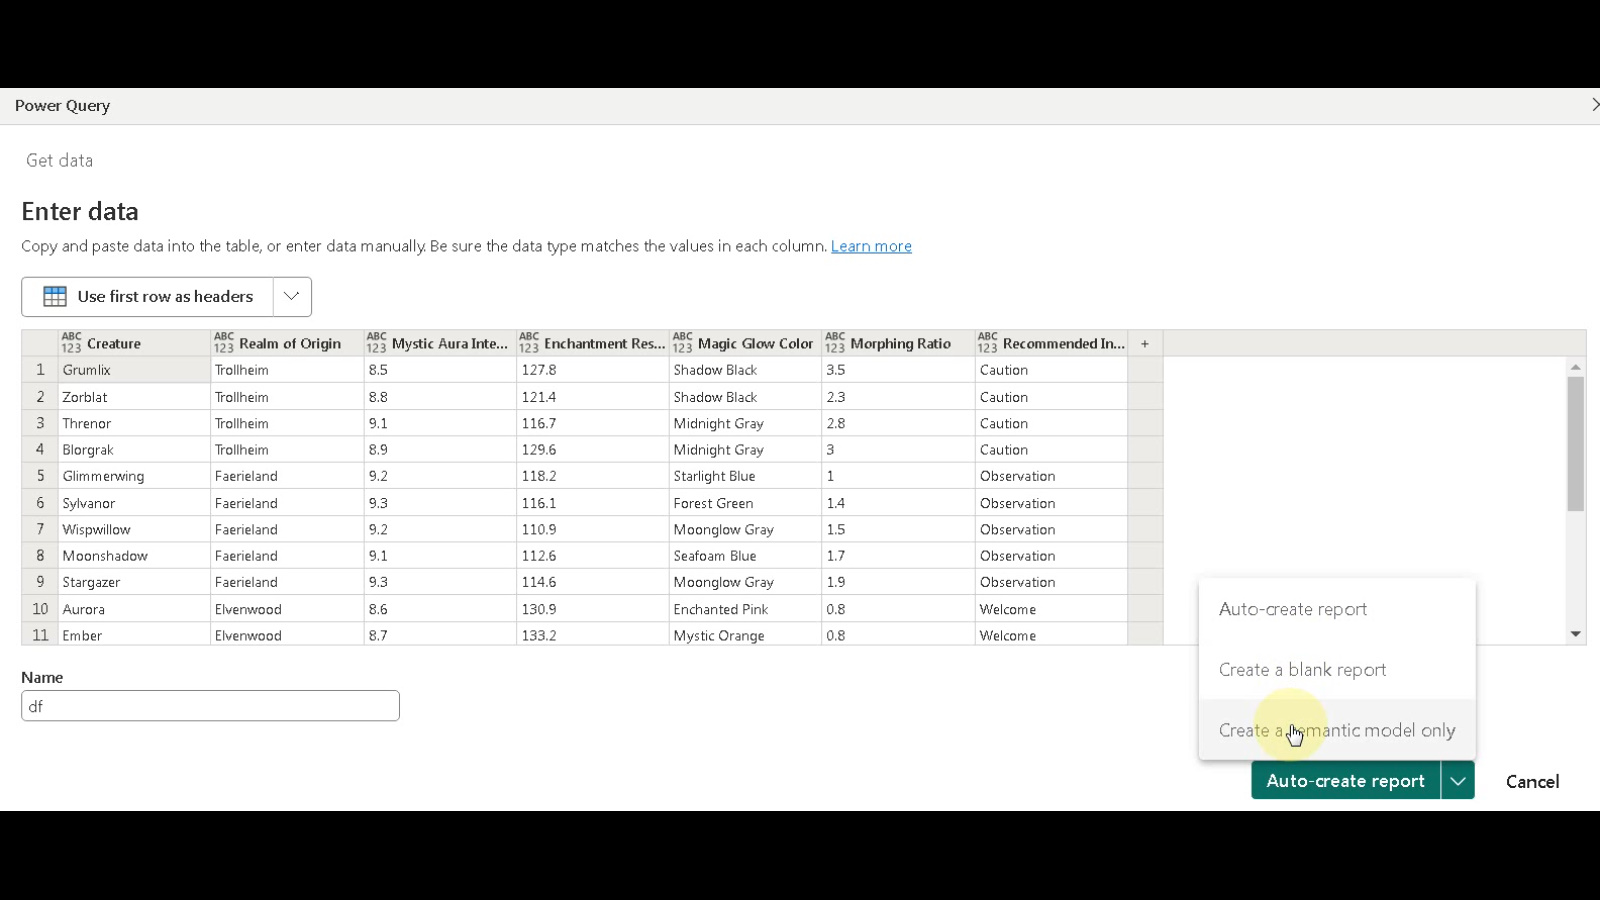
- Create Semantic Model: From the dropdown menu available in the top bar, select “Create a semantic model only”. This option ensures you’re building the data structure for analysis.
Opening and Working with the Data Model
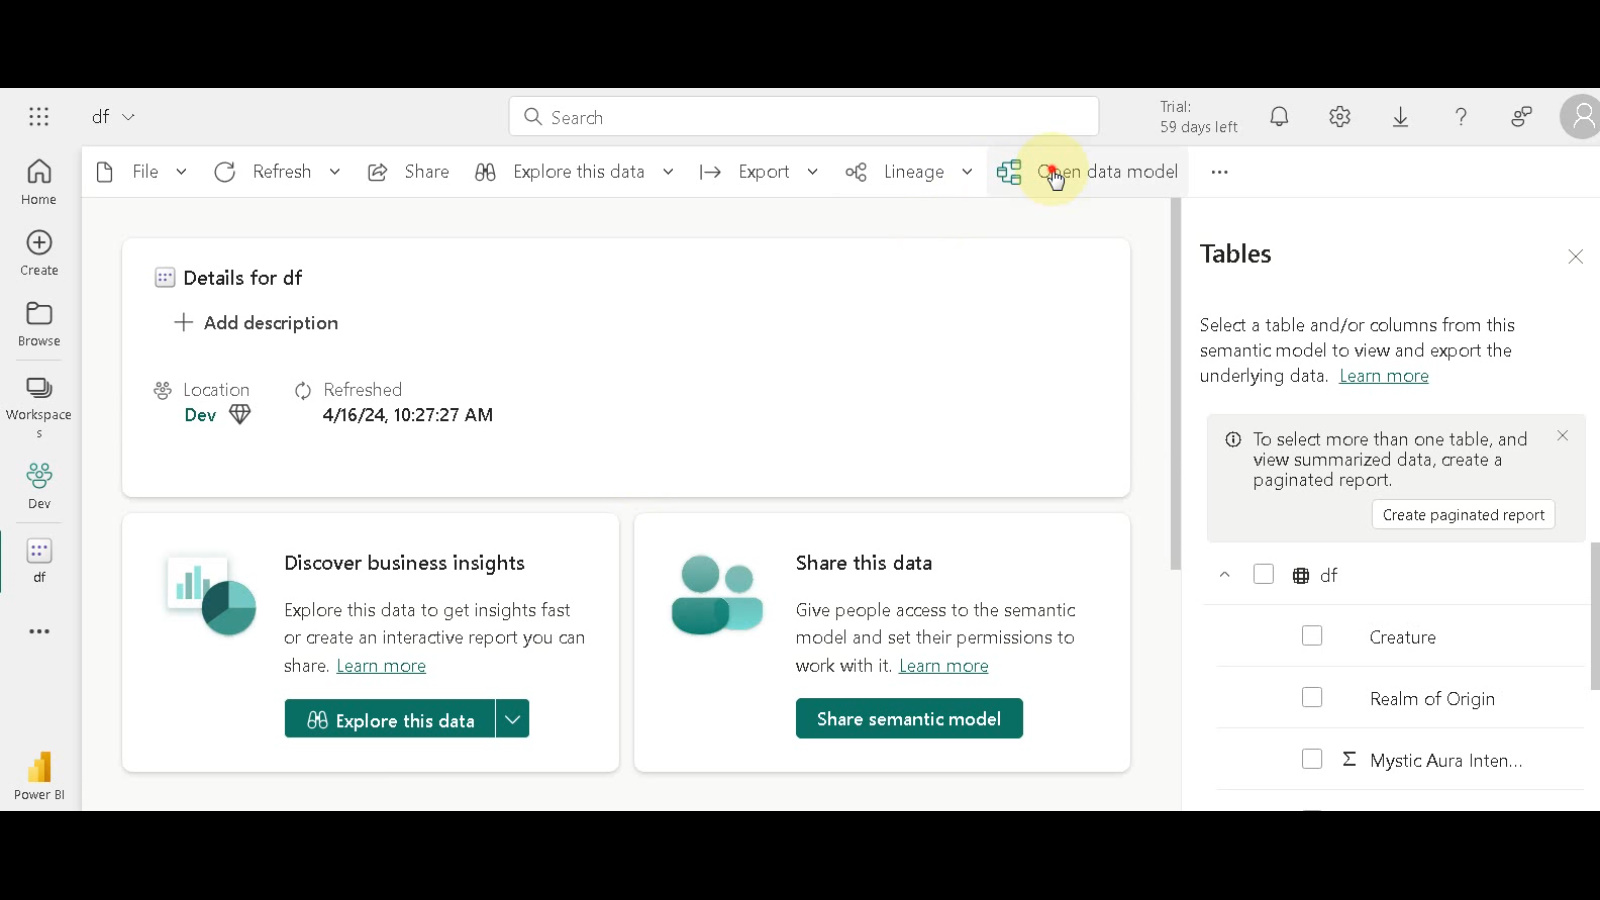
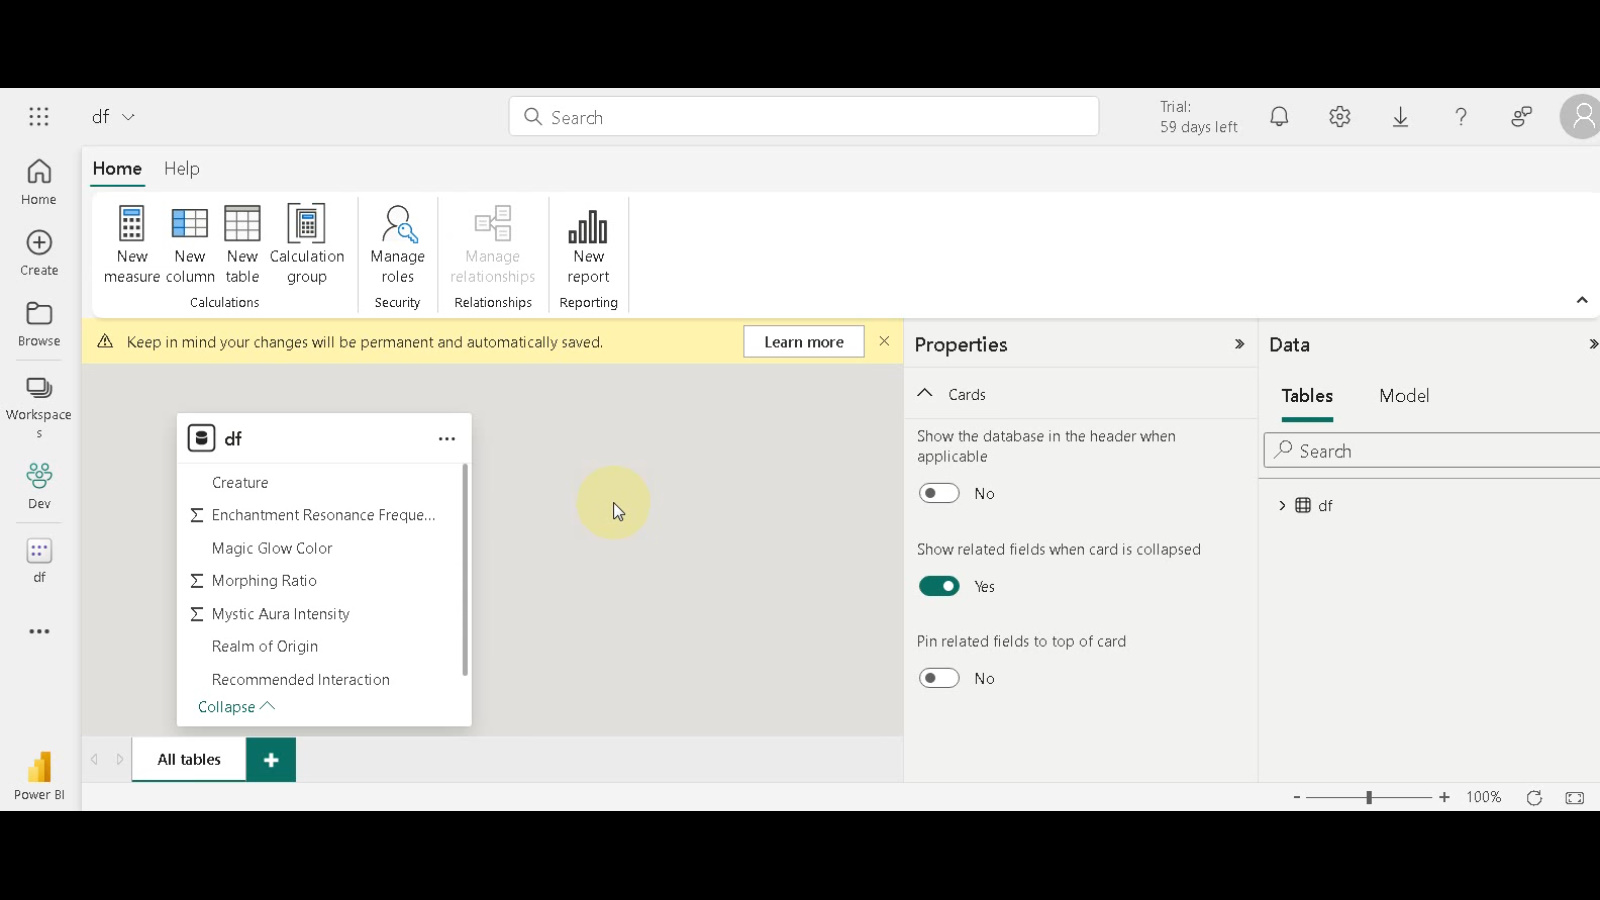
- Access Data Model View: Click “Open Data Model”. You’ll now see your “FactTable” within the data model view. Here, you can create relationships between tables, define hierarchies for your data elements, and manipulate the overall schema to optimize your data analysis.
Conclusion
By leveraging Microsoft Fabric’s data management capabilities and Power BI Desktop’s robust modeling features, you can create a powerful and flexible foundation for your reports. This blog post provided a high-level overview of the process with accompanying visuals. Remember to consult the official Microsoft documentation for more in-depth guidance on specific functionalities within both Microsoft Fabric and Power BI.

