
Facial Recognition and Facial Landmark Analysis with Python
![]()
Facial recognition and landmark detection have become central to many applications ranging from biometric authentication to augmented reality. In this tutorial, we walk through a practical workflow using Python’s face_recognition, Pillow, and Shapely libraries to detect faces, extract facial landmarks, and analyze geometric structures of facial features.
We also generate random synthetic faces for demonstration using the thispersondoesnotexist.com service.
Installing Dependencies
To start, install the face_recognition library. If you have GPU support, it speeds up computations:
!pip install face_recognition >&/dev/null #gpu
We also use several standard libraries for image handling, visualization, and geometric analysis:
import requests
import face_recognition
from PIL import Image, ImageDraw
import matplotlib.pyplot as plt
import pandas as pd
from shapely.geometry import Polygon, LineString
Downloading Random Faces
We fetch three synthetic faces for our demonstration:
# Download 3 random faces
image_paths = ["/content/frontal1.jpg", "/content/frontal2.jpg", "/content/frontal3.jpg"]
for path in image_paths:
    resp = requests.get("https://thispersondoesnotexist.com/")
    if resp.status_code == 200:
        with open(path, "wb") as f:
            f.write(resp.content)
Visualizing Faces, Face Boxes, and Facial Landmarks
We create a 3x3 plot to visualize each image in three ways: plain image, face bounding boxes, and landmark connections.
# Prepare 3x3 plot
fig, axs = plt.subplots(3, 3, figsize=(15, 15))

for col, path in enumerate(image_paths):
    # Load image
    image = face_recognition.load_image_file(path)
    pil_image = Image.fromarray(image)

    # --- Top row: plain image ---
    axs[0, col].imshow(pil_image)
    axs[0, col].axis('off')
    axs[0, col].set_title(f"Plain\n{path.split('/')[-1]}")

    # --- Middle row: face boxes ---
    img_box = pil_image.copy()
    draw_box = ImageDraw.Draw(img_box)
    face_locations = face_recognition.face_locations(image)
    for (top, right, bottom, left) in face_locations:
        draw_box.rectangle(((left, top), (right, bottom)), outline="red", width=3)
    axs[1, col].imshow(img_box)
    axs[1, col].axis('off')
    axs[1, col].set_title("Face Box")

    # --- Bottom row: facial features landmarks ---
    img_landmarks = pil_image.copy()
    draw_landmarks = ImageDraw.Draw(img_landmarks)
    landmarks_list = face_recognition.face_landmarks(image)
    for landmarks in landmarks_list:
        for feature, points in landmarks.items():
            # Draw lines connecting landmark points
            draw_landmarks.line(points + [points[0]], fill='cyan', width=2)
    axs[2, col].imshow(img_landmarks)
    axs[2, col].axis('off')
    axs[2, col].set_title("Facial Features")

plt.tight_layout()
plt.show()
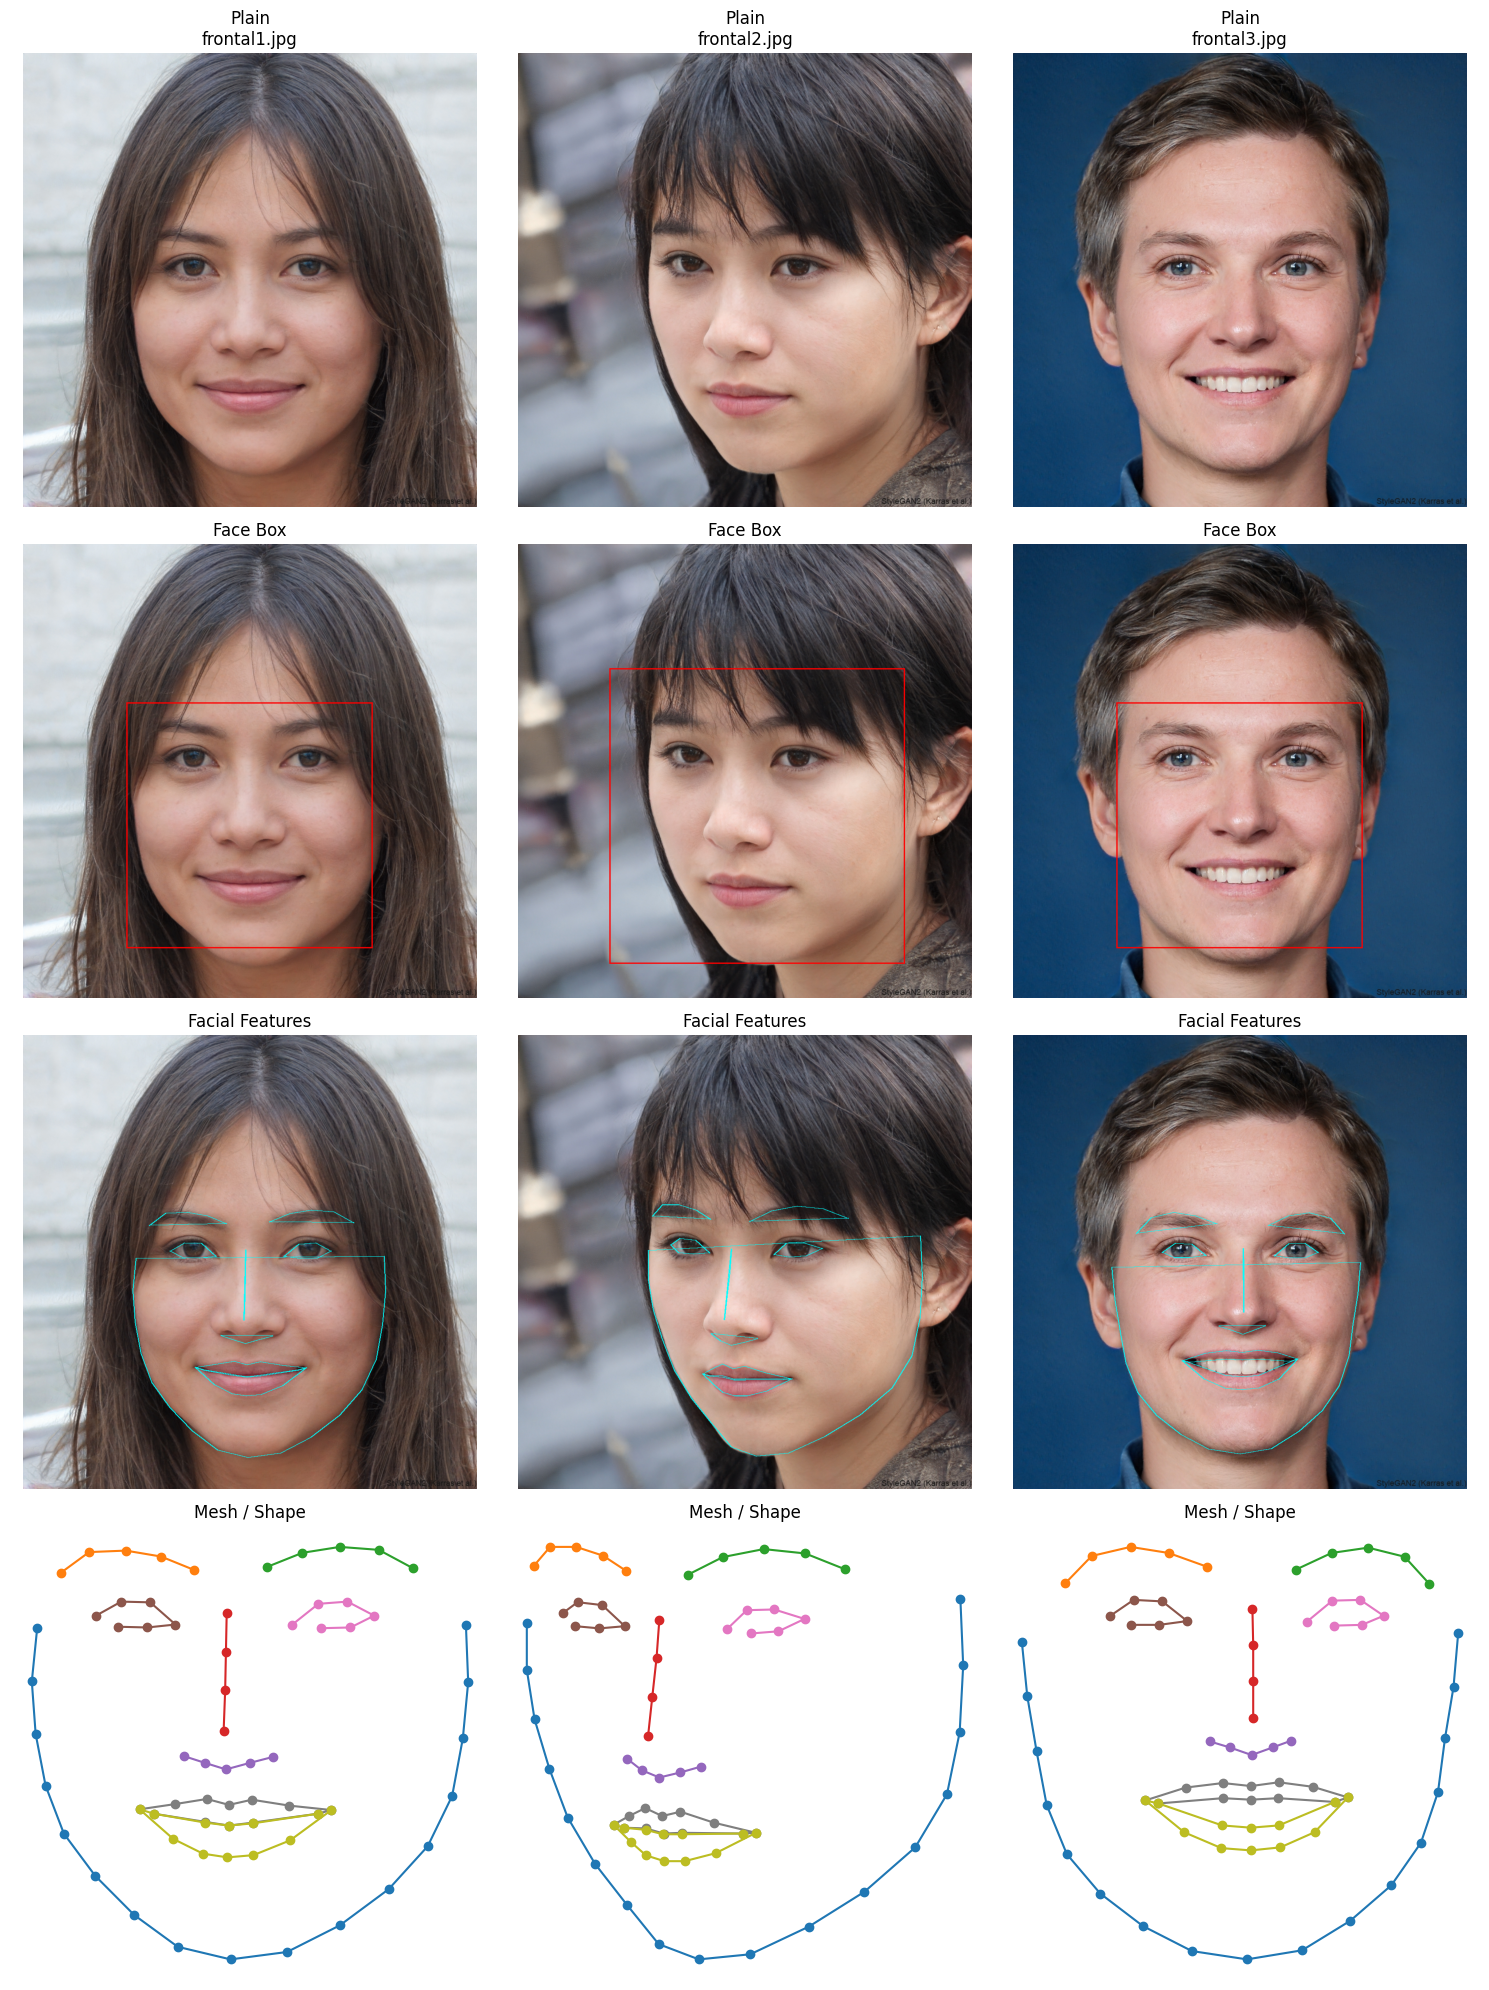
Advanced Visualization with Shapely Mesh
For geometric analysis, we can represent facial landmarks as LineStrings or Polygons using Shapely. This allows us to visualize a mesh structure for each face:
from shapely.geometry import LineString, Polygon
import matplotlib.pyplot as plt

# Prepare 4x3 plot (4 rows: plain, boxes, landmarks, mesh)
fig, axs = plt.subplots(4, 3, figsize=(15, 20))

for col, path in enumerate(image_paths):
    # Load image
    image = face_recognition.load_image_file(path)
    pil_image = Image.fromarray(image)

    # --- Top row: plain image ---
    axs[0, col].imshow(pil_image)
    axs[0, col].axis('off')
    axs[0, col].set_title(f"Plain\n{path.split('/')[-1]}")

    # --- 2nd row: face boxes ---
    img_box = pil_image.copy()
    draw_box = ImageDraw.Draw(img_box)
    face_locations = face_recognition.face_locations(image)
    for (top, right, bottom, left) in face_locations:
        draw_box.rectangle(((left, top), (right, bottom)), outline="red", width=3)
    axs[1, col].imshow(img_box)
    axs[1, col].axis('off')
    axs[1, col].set_title("Face Box")

    # --- 3rd row: facial landmarks ---
    img_landmarks = pil_image.copy()
    draw_landmarks = ImageDraw.Draw(img_landmarks)
    landmarks_list = face_recognition.face_landmarks(image)
    for landmarks in landmarks_list:
        for feature, points in landmarks.items():
            draw_landmarks.line(points + [points[0]], fill='cyan', width=2)
    axs[2, col].imshow(img_landmarks)
    axs[2, col].axis('off')
    axs[2, col].set_title("Facial Features")

    # --- 4th row: mesh from Shapely geometries ---
    axs[3, col].set_title("Mesh / Shape")
    axs[3, col].axis('off')

    # Example: draw each feature from landmarks as LineStrings
    for landmarks in landmarks_list:
        for feature, points in landmarks.items():
            line = LineString(points)
            x, y = line.xy
            axs[3, col].plot(x, y, marker='o')
    axs[3, col].invert_yaxis()  # optional: match image coordinates

plt.tight_layout()
plt.show()
Creating a DataFrame of Geometric Features
We can systematically store each feature as a geometric object in a pandas DataFrame:
# Initialize list for rows
data = []

# Process each image and extract geometric shapes
for img_idx, path in enumerate(image_paths):
    image = face_recognition.load_image_file(path)
    landmarks_list = face_recognition.face_landmarks(image)

    for face_idx, landmarks in enumerate(landmarks_list):
        for feature, points in landmarks.items():
            # Decide if shape should be a closed Polygon or open LineString
            if feature in ['top_lip', 'bottom_lip', 'left_eye', 'right_eye', 'nose_tip']:
                shape = Polygon(points)
            else:
                shape = LineString(points)

            data.append({
                'image': path.split('/')[-1],
                'face_index': face_idx,
                'feature': feature,
                'geometry': shape
            })

# Create DataFrame
df_shapes = pd.DataFrame(data)

# Optional: display the DataFrame
df_shapes
This structure makes it easy to query specific features or images, for example:
df_shapes[
(df_shapes["image"] == "frontal1.jpg") & (df_shapes["feature"] == "top_lip")
]["geometry"].values[0]
Visualizing Individual Features
Shapely geometries allow easy plotting of specific facial features:
import matplotlib.pyplot as plt
from shapely.geometry import LineString, Polygon

# Example: features_and_geometry has 'feature' and 'geometry' columns
for feature, geom in zip(features_and_geometry['feature'], features_and_geometry['geometry']):
    plt.figure(figsize=(4, 1))

    # Shapely: get coordinates for plotting
    if isinstance(geom, LineString):
        x, y = geom.xy
    elif isinstance(geom, Polygon):
        x, y = geom.exterior.xy
    else:
        continue  # skip unsupported types

    plt.plot(x, y, marker='o')
    plt.title(feature)
    plt.axis('equal')
    plt.axis('off')
    plt.show()
Summary
In this blog, we demonstrated:
- Fetching synthetic faces for testing.
- Detecting faces and facial landmarks using
face_recognition. - Visualizing faces, bounding boxes, landmarks, and geometric meshes.
- Structuring facial feature geometry in a pandas DataFrame for further analysis.
- Leveraging Shapely to represent features as LineStrings or Polygons, enabling geometric computations and plotting.
This workflow provides a robust foundation for facial analysis, feature-based machine learning, or advanced AR/VR applications.
